Climate Mitigation Strategies
Efforts to reduce or prevent emission of greenhouse gases are underway across the United States.
What a community or organization may choose to do to reduce their emissions is based on their varying capacity. MPO staff is available to help work through custom mitigation measures.
Additionally, the below are selected examples to reference when starting to set reduction goals. The subjects are based on standard GHG inventory sectors:
Transportation, Commercial, Residential, Electricity, Industry, and Agriculture.
Transportation
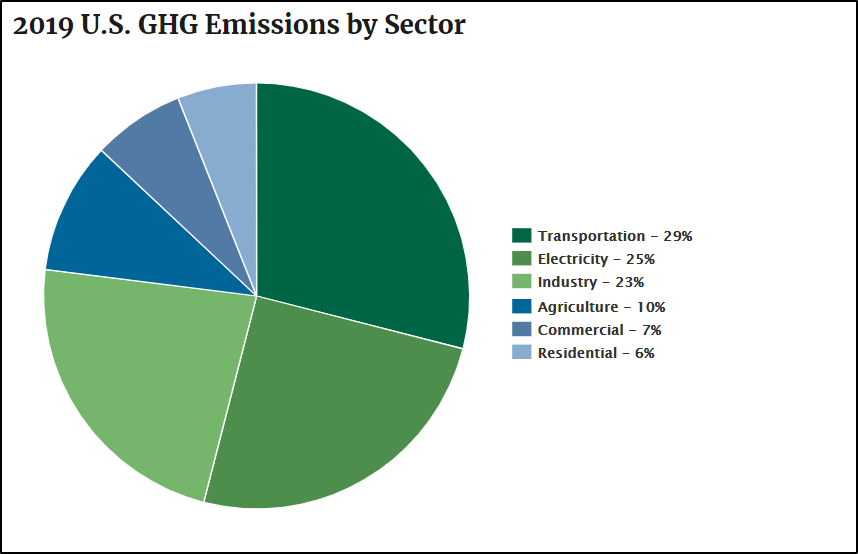
Across the US and in Iowa, transportation is a leading GHG emitter; the vast majority of which is carbon dioxide (CO2) from light-duty vehicles (passenger vehicles).
Central Iowa does not have the smog other cities face due to topography and geography. However Des Moines’s 2017 GHG inventory showed transportation emits 26% of the community-wide emissions, making it the third largest contributor.
Regionally speaking, Des Moines is the urban core of the metropolitan area and has higher population and development densities. As more community GHG inventories are drafted and released, it would be expected for this proportion to trend upwards in many suburban communities. Making mitigation strategies in this sector a higher priority when reducing emissions.
Like all other sectors, there are a number of pathways a community or organization can take to reduce emissions from transportation:
- Increasing community density through mixed-use or transit-oriented design
- Established regional strategies can be found in The Tomorrow Plan
- Promoting alternative transportations as a mode-choice to reduce vehicle miles traveled (VMT)
- Promoting combinations like bus & bike, walking, car & bus, car & bike, etc. are great ways to start mode-choice changes
- Increasing access to alternative fuels through infrastructure like EV charging
- National studies show, roughly half of EV charging is done at home, and so readiness and retrofitting of garage and exterior electric capacities will be imperative
- The second highest is the workplace.
- Convert vehicle fleets to electric or other alternative fuels
Residential and Commercial
Americans spend roughly 90% of their time indoors.
As such, buildings are vital to society, and have a large part to play in reducing emissions.
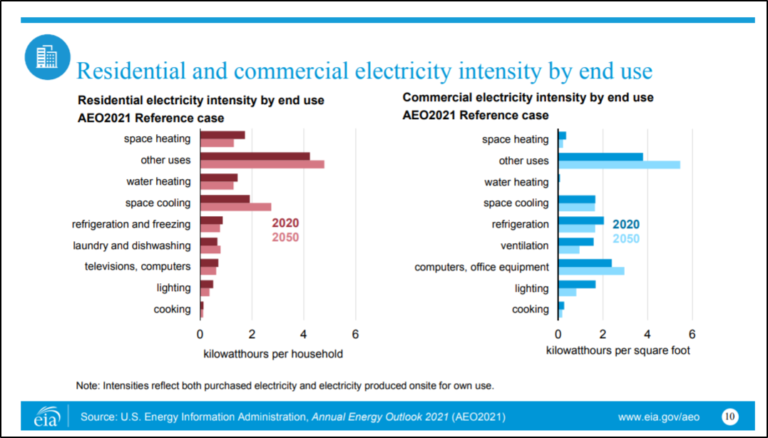
If you’ll recall, the Des Moines 2017 Inventory of Community Greenhouse Gas Emissions Report showed the cities residential and commercial buildings consume 62% of all emissions. Again, as more communities around Central Iowa conduct GHG inventories, this could shift, however buildings will still be a large proportion.
Below are a few measures communities or organizations could choose to add to their climate action:
- Tap into US Department of Energy’s SolSmart program for no-cost technical assistance in identifying and addressing local barriers to renewable energy production
- Create energy benchmarking program to establish baseline consumption rates and track progress
- Allow for broader renewable energy production on private property like solar, geothermal, and small-scale wind
- Update energy efficiency standards for new or redeveloped buildings
- Increase availability of garage and exterior electric plumbing to enable broader recharging capacity on site
88% of GHG emissions in Des Moines come from the above three sources.
Electricity Generation
Depending on your location in Central Iowa, your electricity comes from either Alliant Energy or MidAmerican Energy.
Both providers have and continue to make large investments in renewable energy. In fact, in 2020 wind turbines generated 57% of Iowa’s electricity, the highest wind power share for any state.
Beyond these large-scale providers, renewable energy production is feasible across Central Iowa. And, there are opportunities at every scale for communities and jurisdictions to positively contribute to energy production:
- Create an energy district to assist in energy audits or planning and increase consumer awareness and efficiency opportunities
- Adapt zoning, ordinances, and codes to increase renewable energy production
- Enable group purchasing for residential and commercial renewable energy installations
- Build renewable energy education and job training into technical training at schools, colleges, and universities
Strategies still to come…
Industry
Agriculture